
Infographics
Data Visualized stories realized
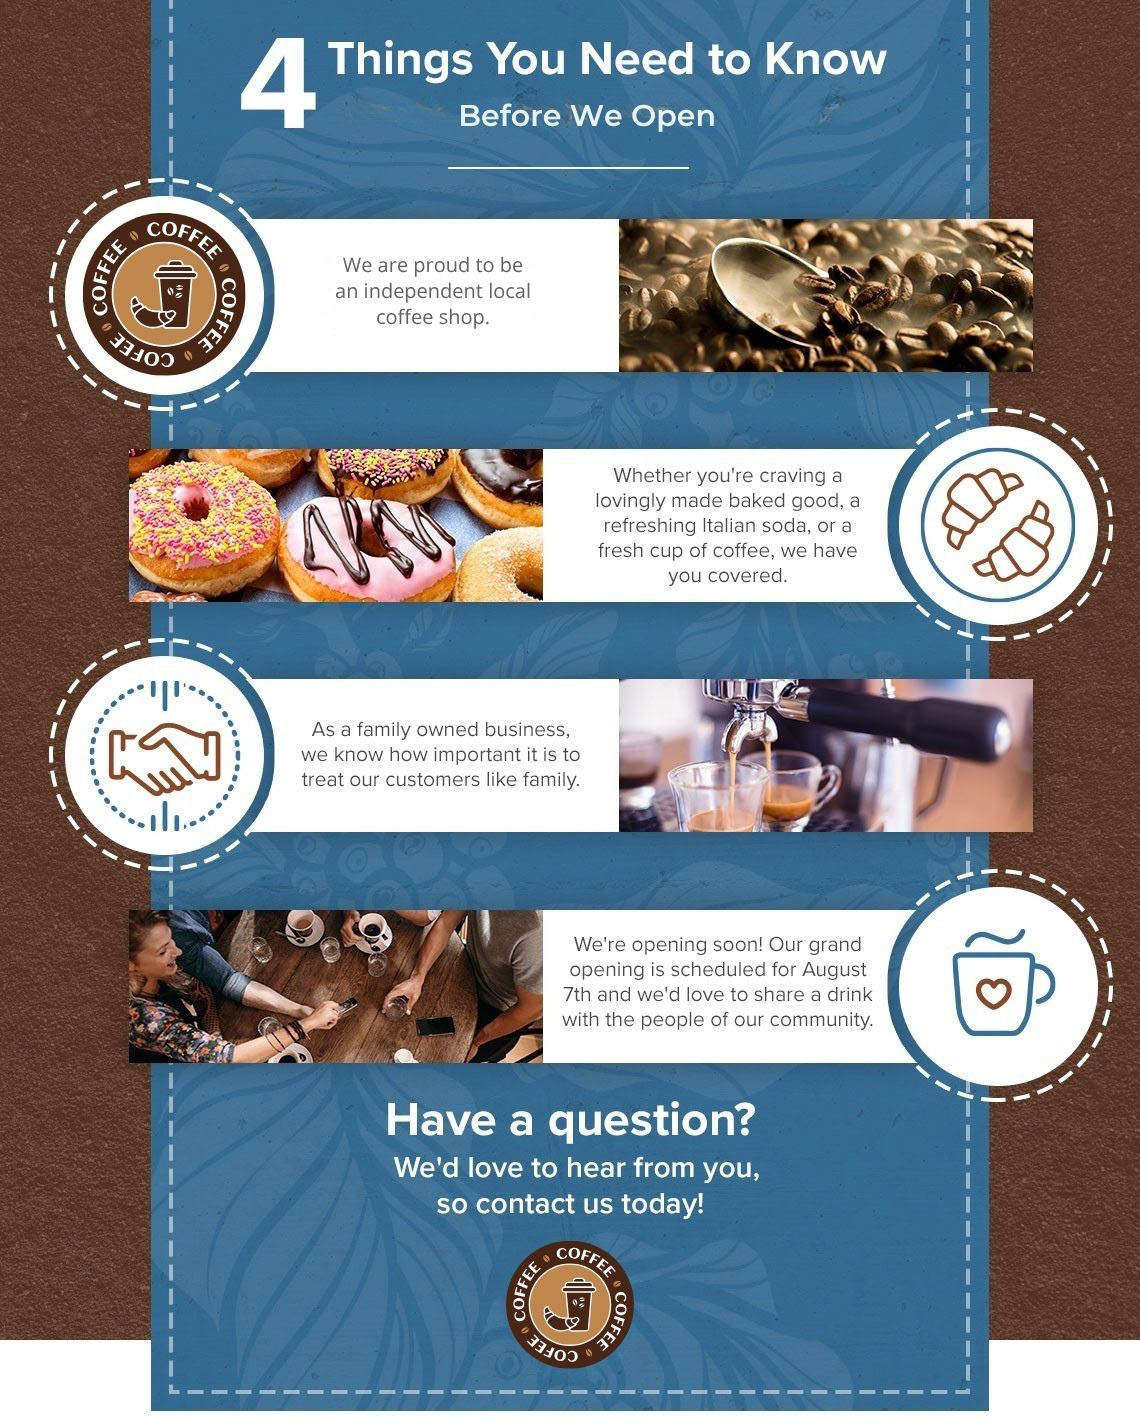
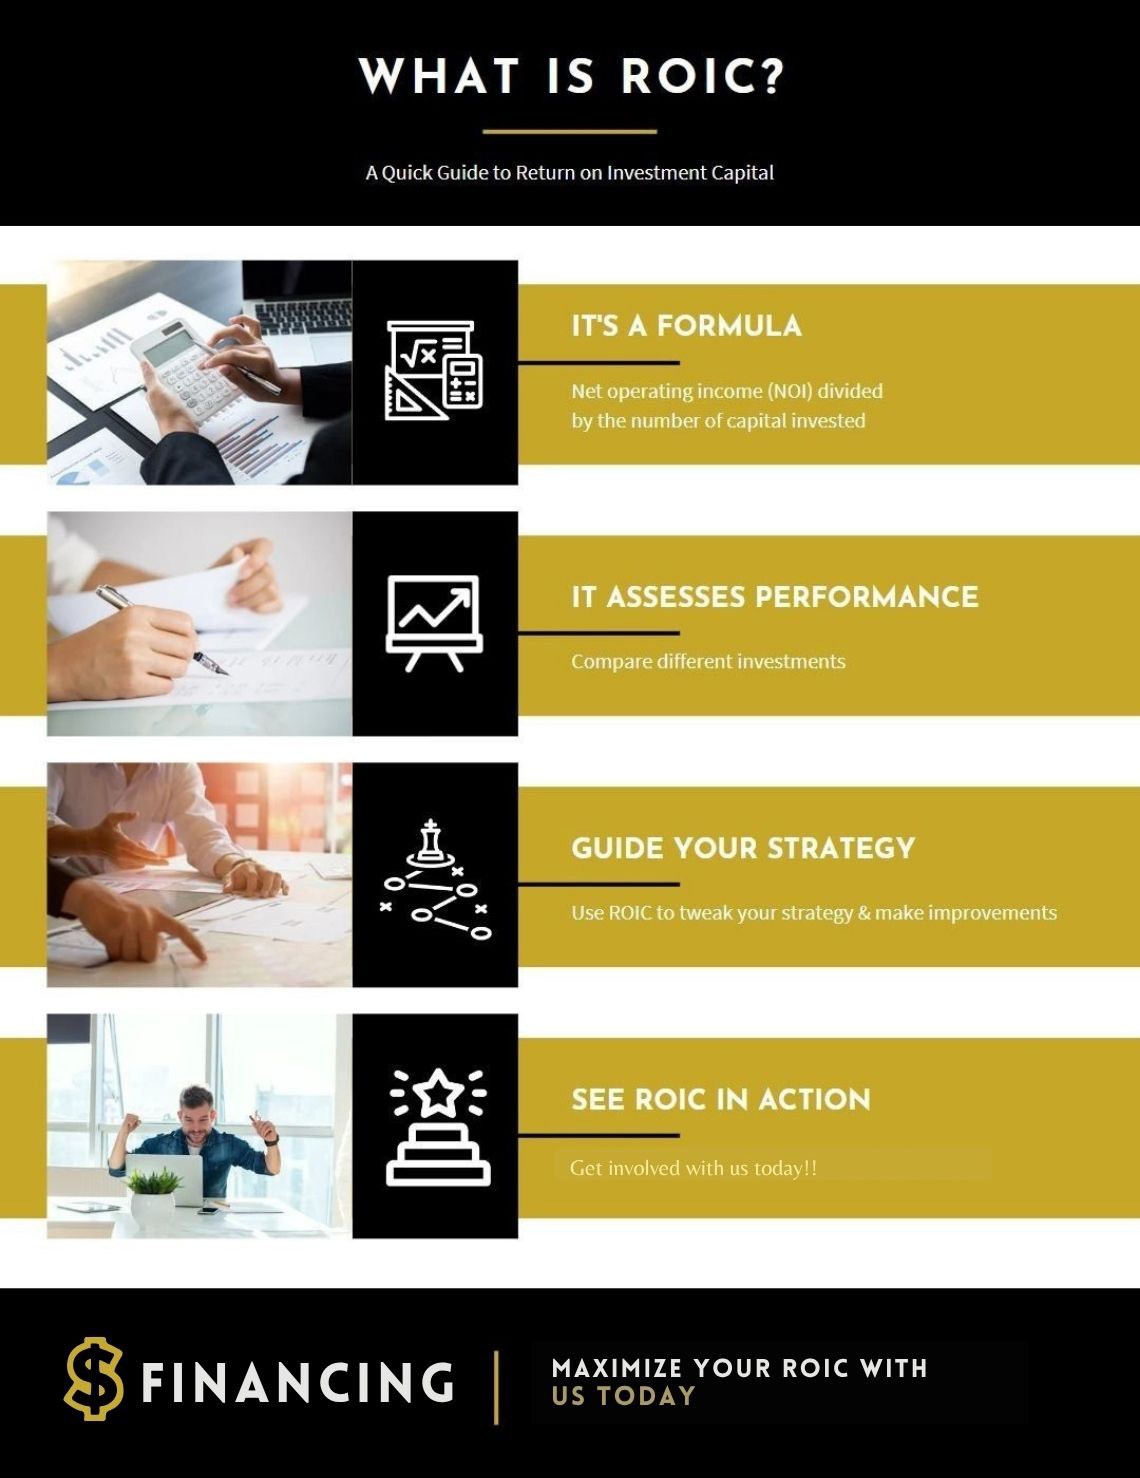
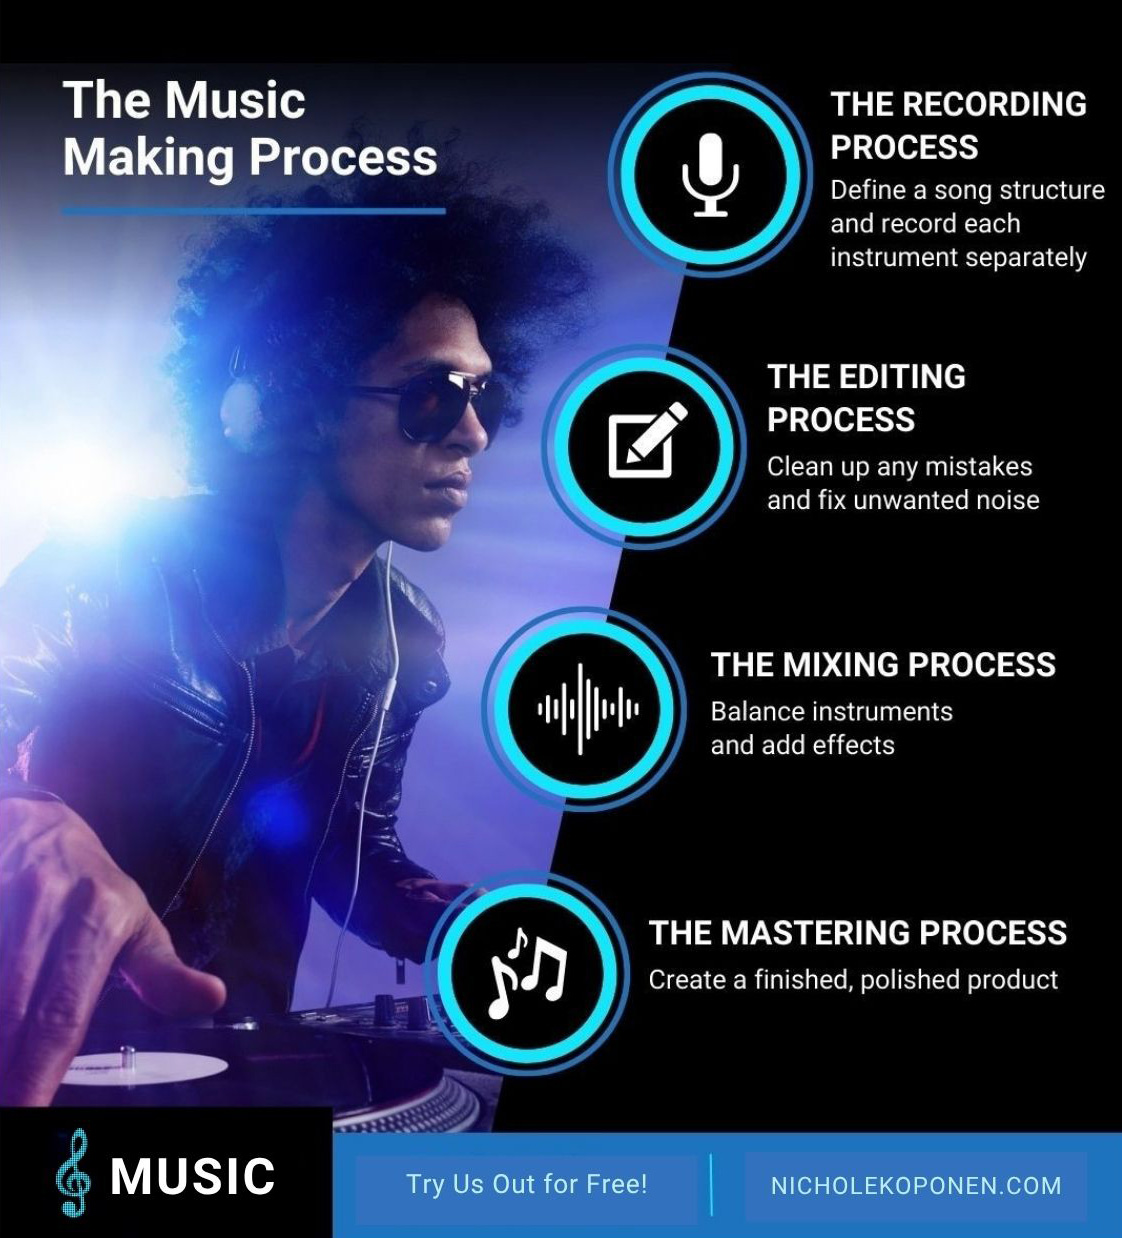
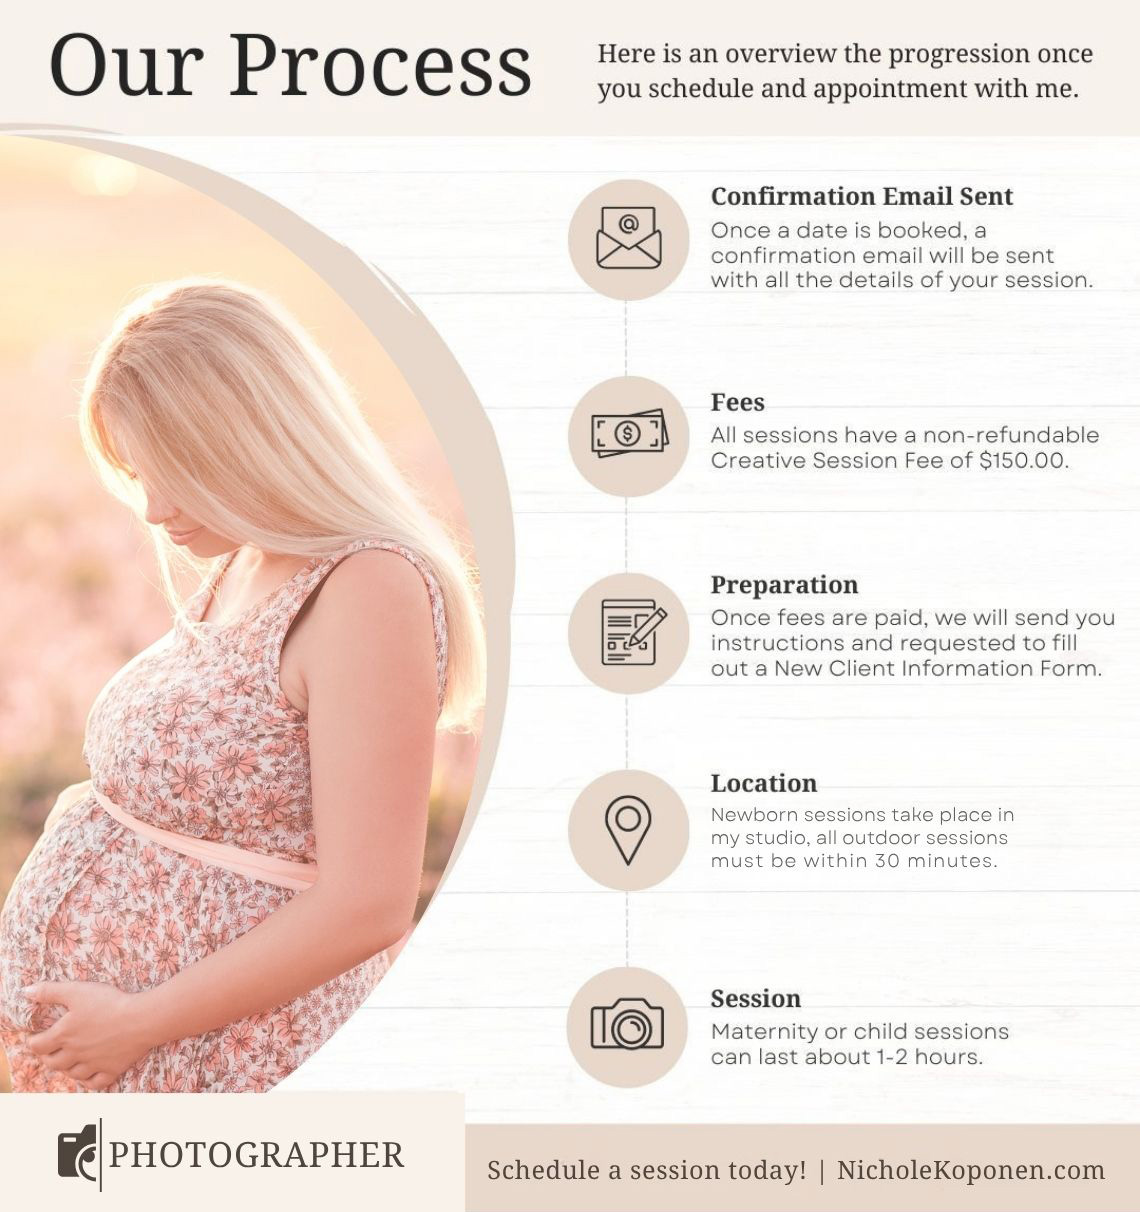
Numbers alone don't stick — stories do. I turn dense data into data visualization that's actually worth looking at, using infographic design built on clear visual hierarchy so the eye knows exactly where to go. Every graphic's designed for real audience engagement, with brand consistency holding steady at 100% across every asset — modern, effective, and instantly readable.

Photoshop

Illustrator

Canva

Figma



let's get started!
Ready to bring your next big idea to life? Explore my design portfolio to see how we can push creative boundaries together. Let’s connect and start building something extraordinary.